

A conceptual introduction to how 2D IR spectroscopy reveals vibrational coupling, molecular fluctuations, and ultrafast dynamics in complex systems.
What is 2DIR?
Two-dimensional infrared (2D IR) spectroscopy is a powerful technique for studying how molecules move, fluctuate, and interact across ultrafast timescales.
Unlike conventional infrared spectroscopy, which mainly reports vibrational frequencies, 2DIR reveals how vibrational modes couple to one another and how molecular environments change over time. This allows researchers to directly probe hydrogen-bond rearrangement, solvation dynamics, structural fluctuations, and intermolecular interactions in complex systems. By combining frequency resolution with femtosecond time resolution, 2DIR provides a dynamic view of molecular behavior that is often inaccessible to traditional spectroscopic approaches.
From Static Structure to Molecular Dynamics
Molecules are never still. Hydrogen bonds continuously form and break. Solvent molecules reorganize around solutes. Proteins fluctuate between multiple conformations instead of remaining fixed structures. In liquids and biological systems, these motions happen on timescales of picoseconds (10⁻¹² s), and they directly govern how molecules recognize each other, how proteins fold and misfold, and how biological assemblies organize and dissolve.
Conventional infrared spectroscopy measures which frequencies a molecule absorbs, providing a structural snapshot. Two-dimensional infrared spectroscopy (2D IR) goes further: by using sequences of femtosecond laser pulses and recording how vibrational responses evolve over time, it measures molecular motion directly, on the timescale it actually occurs.
From 1D IR to 2D IR
A conventional IR spectrum answers one question: what frequencies does this molecule absorb? The result is a one-dimensional plot of absorption versus frequency, which is useful for identifying functional groups and secondary structures, but is silent about dynamics. 2D IR asks a different question: after a molecule absorbs at one frequency, what happens next?
The conceptual origins of 2D IR spectroscopy can be traced back to two-dimensional nuclear magnetic resonance (2D NMR), which transformed structural biology by revealing correlations between nuclear spins rather than measuring isolated resonances. Scientists soon realized that a similar idea could be applied to molecular vibrations. Traditional infrared spectroscopy measures vibrational frequencies associated with chemical bonds, providing valuable structural information about molecules and their local environments. However, many important molecular processes arise not from isolated vibrations, but from interactions between vibrational modes and fluctuations in the surrounding environment.
The challenge was experimental. Molecular vibrations evolve extremely quickly, often on femtosecond (10⁻¹⁵ s) timescales, requiring ultrafast infrared laser pulses capable of tracking molecular motion in real time. These technologies only became feasible in the 1990s with the development of femtosecond laser systems and ultrafast pump-probe spectroscopy. By 2000, the first true 2D IR experiments had been demonstrated, opening a new experimental window into molecular dynamics.
How Does 2D IR Work?
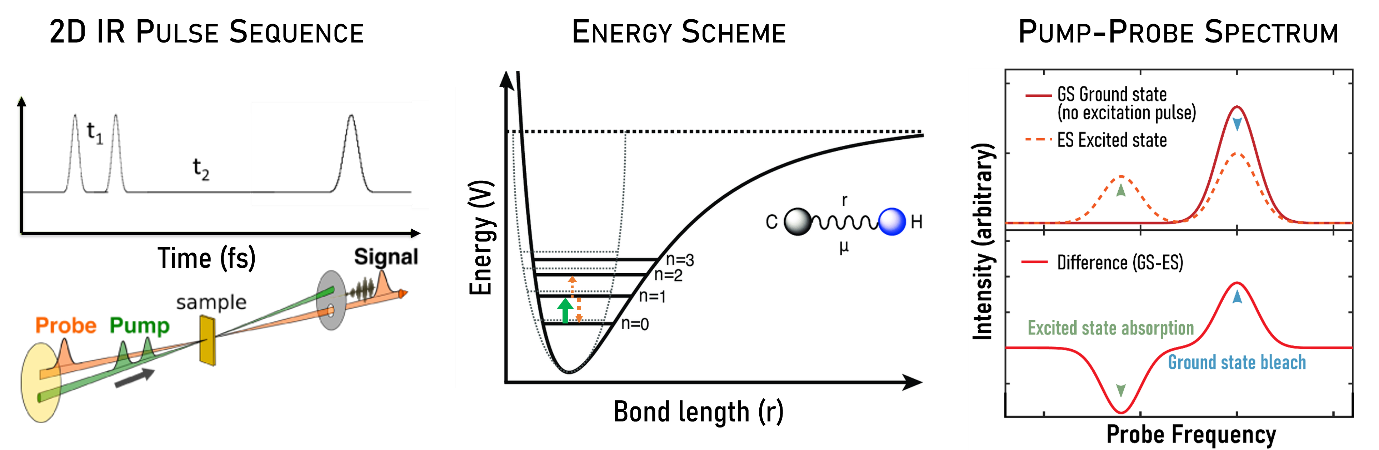
Figure 1. Principal of 2DIR
In a typical experiment, a sequence of femtosecond infrared pulses interacts with the sample in a carefully controlled manner. In modern 2DIR experiments, the excitation frequency axis is generated through Fourier transformation of the coherence time t₁, rather than by directly scanning infrared frequencies. The first pair of pulses, often referred to as the pump pulses, excites a specific vibrational mode and establishes a vibrational coherence within the system.
After a controlled waiting time, a third pulse probes how the molecular system has evolved. By systematically varying the time delays between ultrafast pulses and recording the resulting nonlinear vibrational response, researchers reconstruct a two-dimensional spectrum that reveals how vibrational modes are coupled and how molecular environments evolve over time. Unlike conventional IR spectroscopy, which primarily reports absorption frequencies, 2DIR reveals relationships between vibrational modes and how these relationships fluctuate within complex molecular environments.
2D IR spectroscopy measures how vibrational excitations evolve and interact after a molecule is perturbed by ultrafast infrared laser pulses.
Reading a 2D IR Spectrum
A 2D IR spectrum is displayed as a two-dimensional contour or pseudocolor plot. The horizontal axis is the excitation (pump) frequency; the vertical axis is the detection (probe) frequency. Signal intensity is shown by color or contour density, with positive and negative peaks arising from ground-state bleach and excited-state absorption, respectively.
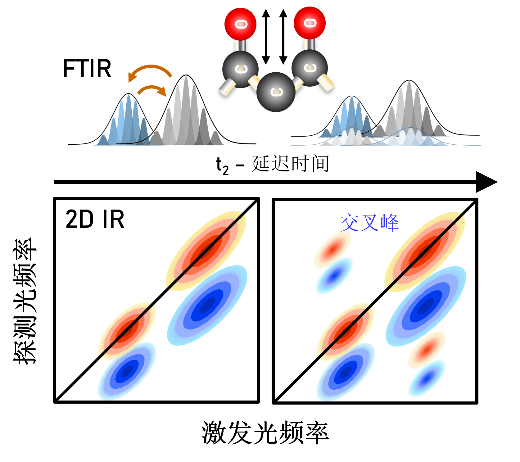
Figure 2. Schematic of Cross Peaks in Two-Dimensional Infrared (2DIR) Spectroscopy: Cross peaks appear in the 2DIR spectrum when there is an interaction between two vibrational modes. The position and intensity of these peaks reveal the degree of coupling between different vibrational modes within the molecule.
Diagonal peaks fall along the line where excitation frequency equals detection frequency. They correspond to the same fundamental vibrations seen in conventional IR and reflect the response of individual modes to their local environments. At short waiting times, diagonal peaks are elongated along the diagonal, a signature of inhomogeneous broadening, meaning different molecules in the sample experience slightly different local environments and absorb at slightly different frequencies.
Cross peaks appear off the diagonal when two modes are coupled. Their presence is direct evidence of an interaction: two vibrations sharing a chemical bond, two groups within hydrogen-bonding distance, or two modes exchanging energy. The appearance, position, and evolution of cross peaks often reveal information that is hidden in traditional one-dimensional spectra, particularly in heterogeneous or dynamically fluctuating environments.
Diagonal peaks reveal individual vibrations, while cross peaks reveal interactions between them.
Advanced view: from peak shapes to molecular dynamics
Beyond identifying diagonal peaks and cross peaks, 2D IR spectra contain quantitative information in their peak shapes. As the waiting time t₂ between pump and probe pulses increases, diagonal peaks often evolve from elongated shapes toward more rounded contours. This evolution, commonly described as spectral diffusion, reflects how quickly a vibrational mode loses memory of its initial local environment.
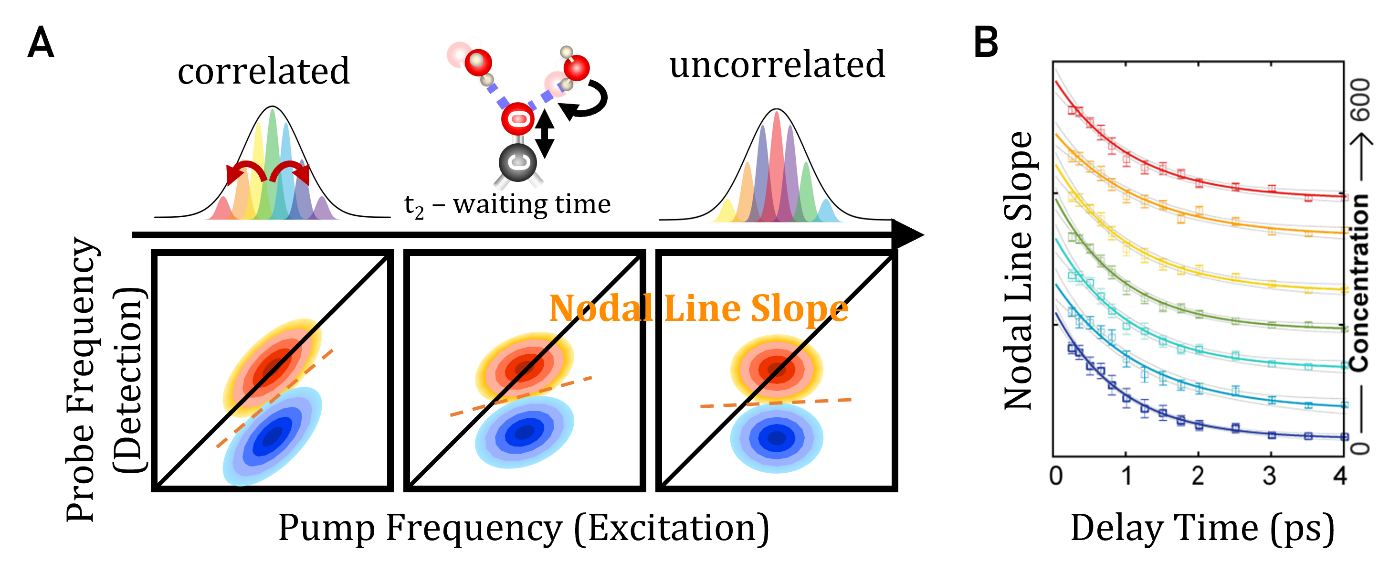
Figure 3. A. Schematic of Spectral Diffusion and Lineshape Analysis in 2DIR. Energy exchange between the vibrational probe and the surrounding solvent leads to frequency decorrelation between the pump and probe pulses. B. The center line slope (CLS) decays exponentially as a function of t₂ delay time, providing information about the local environment and relaxation dynamics.
The rate of this evolution is not arbitrary noise. In heterogeneous systems, different molecules or molecular subensembles may initially experience slightly different local environments, producing a distribution of vibrational frequencies. As solvent molecules rearrange, hydrogen bonds fluctuate, or conformations interconvert, these frequencies become decorrelated over time. It encodes the timescales of molecular motion. For example:
how fast hydrogen bonds rearrange
how quickly solvent molecules reorganize around a solute
how rapidly a protein samples different conformational states
Quantitatively, spectral diffusion is described by the frequency-frequency correlation function (FFCF), which measures how a vibrational frequency at time zero correlates with the same frequency at a later time. Two experimental observables are commonly used to extract the FFCF: the nodal line slope (NLS) and the center line slope (CLS), both of which decay from 1 toward 0 as frequency correlation is lost. Fitting this decay to exponential or multiexponential models gives the timescales and amplitudes of environmental fluctuations directly.
Spectral diffusion reflects how rapidly molecular environments reorganize around a vibrational mode.
What 2D IR reveals in practice
Hydrogen-bond dynamics and hydration. Vibrational frequencies are acutely sensitive to hydrogen-bond geometry and strength, making 2D IR one of the most direct probes of H-bond network dynamics in aqueous systems. Spectral diffusion measurements in the O–H or O–D stretching region directly report hydrogen-bond rearrangement timescales. In crowded biological environments, such as near protein surfaces, in the presence of osmolytes or within lipid membranes, these timescales differ measurably from bulk water, with direct consequences for molecular stability and recognition. See our work on crowding and interfacial dynamics →
Protein conformation and dynamics. The Amide I band (1600–1700 cm⁻¹), arising primarily from backbone C=O stretching, reports protein secondary structure through its frequency, and reports structural dynamics through its 2D lineshape evolution. Different secondary structures produce characteristic coupling patterns: α-helices and β-sheets generate distinct cross-peak signatures that reflect their different hydrogen-bond geometries. Beyond structure assignment, 2D IR can track conformational fluctuations in real time, probe the dynamics of intrinsically disordered regions, and monitor structural changes during phase transitions.
Molecular recognition and interfacial dynamics. Cross peaks between probes at different frequencies directly report intermolecular contacts and shared solvation environments. Combined with molecular simulation, 2D IR measurements at molecular interfaces — drug-carrier assemblies, protein binding sites, lipid membranes — can reveal how local hydration dynamics shape recognition, binding affinity, and energy transfer pathways. See our work on interfacial hydration and drug delivery →
Ultrafast energy transfer. The time-dependent growth of cross peaks directly reports vibrational energy transfer between coupled modes. This makes 2D IR valuable for studying intramolecular energy redistribution, intermolecular vibrational coupling in hydrogen-bonded networks, and collective excitations in condensed-phase systems.
Because 2DIR directly probes nonequilibrium vibrational dynamics, it is particularly effective for studying chemical exchange processes, energy redistribution, and ultrafast intermolecular relaxation pathways.
Frequently Asked Questions About 2D IR
What does 2D IR actually measure?
2D IR measures how vibrational modes interact and evolve over ultrafast timescales. Unlike conventional IR spectroscopy, which mainly reports vibrational frequencies, 2DIR reveals couplings, energy transfer, structural fluctuations, and environmental dynamics.
What timescales does 2D IR probe?
The waiting time t₂ in a 2D IR experiment can range from tens of femtoseconds to several hundred picoseconds. Hydrogen-bond rearrangement in water occurs on ~1–3 ps; solvation dynamics near biological surfaces typically span 1–10 ps; conformational exchange in proteins can range from picoseconds to nanoseconds.
What does a cross peak tell you?
A cross peak between two frequencies ω₁ and ω₂ indicates that the vibrations at those frequencies are coupled, either through direct bond connectivity, through-space dipolar interaction, or energy exchange. Its intensity reflects coupling strength; its time evolution reflects the dynamics of the coupling environment.
What is spectral diffusion?
Spectral diffusion is the time-dependent change in a vibrational frequency caused by fluctuations in the local molecular environment. The rate of spectral diffusion directly reports the timescale of environmental reorganization, for example, how fast hydrogen bonds break and reform around a probe molecule.
Why is 2D IR particularly suited to biological systems?
Many biological processes are governed by transient interactions and structural fluctuations occurring on ultrafast timescales. 2D IR operates natively on these timescales, and because vibrational frequencies are sensitive to local electrostatic environments, it can resolve heterogeneous dynamics within crowded, disordered, or interfacially complex systems that bulk measurements average over.
Can 2D IR be combined with other techniques?
Yes. In our lab, 2D IR is routinely combined with molecular dynamics simulation — spectral observables are directly compared with FFCF functions computed from MD trajectories, providing atomic-level interpretation of experimental results. 2D IR can also be combined with isotopic labeling (e.g., ¹³C=¹⁸O substitution) to isolate site-specific responses within larger molecular assemblies, and with near-field imaging to access spatially resolved dynamics.